- Introducing the Model Factory
- Introduction
- A Tour of the Model Factory
- Iteration One: Traditional Foundation Model Training
- Iteration Two: Automated Model Evaluations
- Iteration Three: Reinforcement Learning from Code Execution
- Iteration Four: Automated Architecture Ablations
- Iteration Five: Automated Data Refinement
- Iteration Six: Automated Data Mixing
- What does the Model Factory actually give us?
- What does the Model Factory look like in practice?
- High-level layout of the Model Factory
- Dataset management
- Measure all the things
- Pre-training at scale
- Code execution at scale
- Thank you
Table of contents
Introducing the Model Factory
TL;DR: Traditional foundation model training approaches require substantial manual interaction, little signal for improvement, and slow iteration times. To resolve these issues, we built the Model Factory, Poolside’s internal systems framework for quickly training, scaling, and experimenting with novel foundation models. In this post, we share our methodology and reasoning for building the Model Factory.
Introduction
The world of AI is in the midst of a Cambrian explosion: new models, ideas, and techniques surface daily, and keeping up has become a full-time job. New ideas are developed based on intuition, deployed on supercomputer-scale clusters and pushed into production long before the associated theory has caught up. This pace of advancement presents a serious challenge to companies pursuing AGI—namely, how do we scale our ability to evaluate, adopt, and deploy these innovations fast enough to stay ahead?
Organizations typically scale along two axes: scaling with people, and scaling with engineering. Hiring top-tier engineers and researchers can push the boundaries of what is possible, but additional engineers can only scale productivity linearly, at most. The pace of AI, by comparison, is growing at least exponentially; linear growth just will not cut it. In other words, hiring ever more engineers and researchers would not allow us to stay ahead without substantial productivity improvements. This requirement clashes with the traditional, linear approach to training models whereby substantial amounts of engineering time was typically dedicated to manually handling training runs.
Since day one of Poolside, we’ve known that we needed something more: a way to keep up with the pace of our ideas. We needed the ability to test new ideas automatically, benchmark them against reliable baselines, and spin up new models with confidence and speed. We needed the ability to track changes in outcomes back to earlier decisions, a way to conduct hyperparameter searches easily, and a way to inject rigor and reproducibility back into our model training. We even needed a way to fairly schedule all of these competing tasks across a cluster of GPUs.
What we needed was a model factory. And since one didn’t exist, we built our own.
In this blog series, we’ll give you an in-depth tour of Poolside's internal systems framework for training foundation models, which we call the Model Factory. We will show you the Factory's layout, the high-level goals it solves for, and its full assembly line. We dig into how we use it, the machines it’s made up of, and how we incorporate new machinery. We’ll discuss some useful conveyor belts we’ve built for tying machines together, like GPU-to-GPU weight transfer. We’ll even talk about some ideas that we tried but ultimately rejected, like fully auto-tuned matrix multiplications.
But first, let’s get started with a discussion of how the Model Factory came to be, what it enables us to do, and how we power it under the hood.
A Tour of the Model Factory
In order to explain why the Model Factory enables us to handle combinatorial complexity, we first need to understand how it evolved, and how that evolution has led to its current design. In order to do this, let’s consider the following scenario: imagine we want to train a foundation model as optimally as possible.
Iteration One: Traditional Foundation Model Training
As a first approximation, we’ll start by training some pre-determined architecture on a pre-determined dataset. For the sake of simplicity, we’ll follow the common approach of training models: we load data from a data store, run the model's forward pass, compute the loss, run the backwards pass, and repeat this process until we’ve finished processing all of our data. Once we’ve finished training the model, we’ll then apply fine tuning to add basic instruction-following capabilities to the model. This leads to a pipeline that looks something like this:
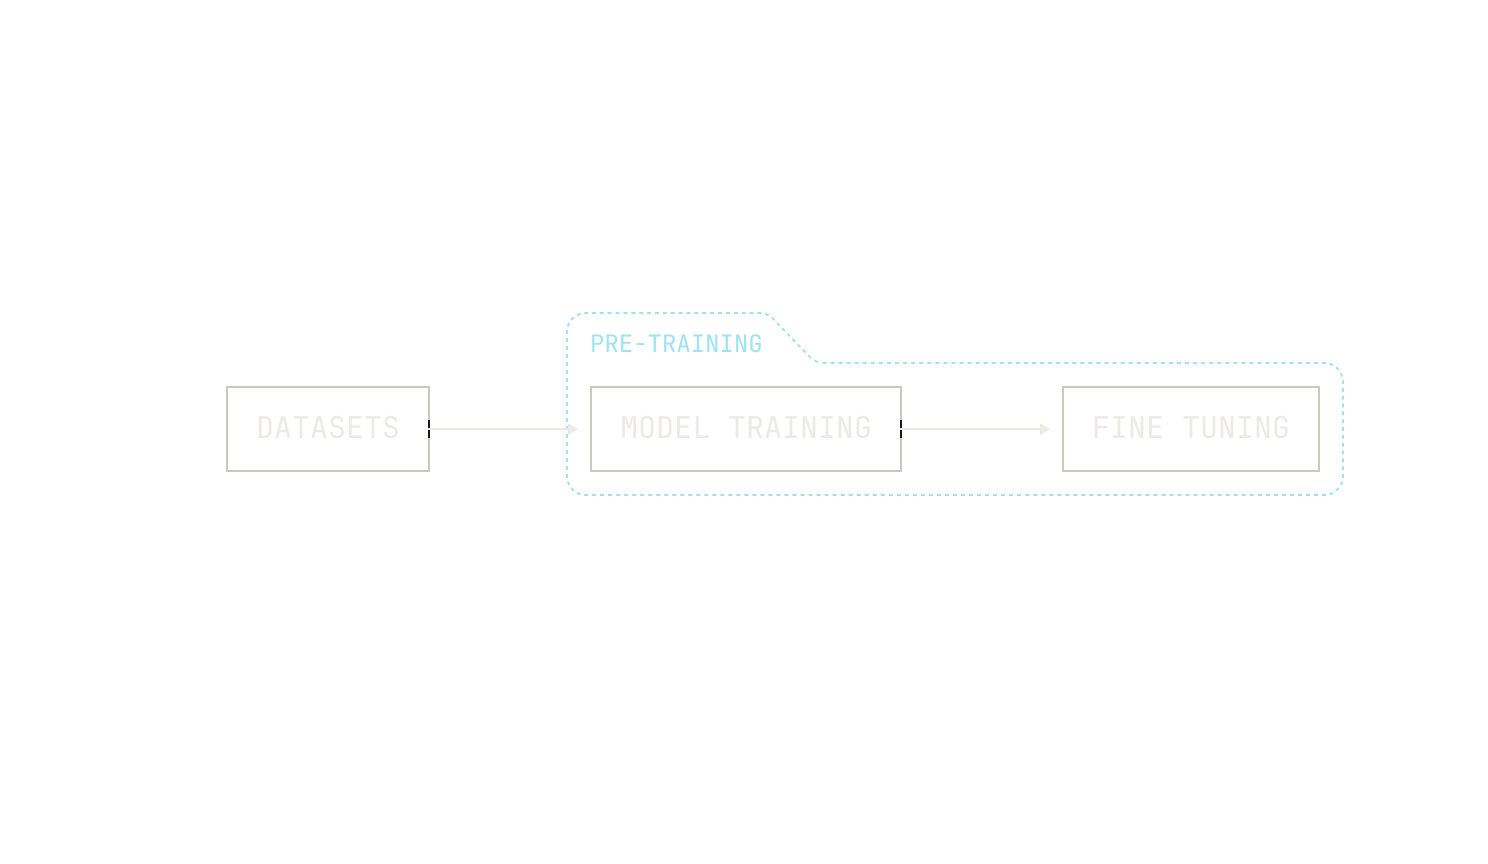
This is a good first approach, but it has many shortcomings. First, notice that because everything is pre-determined ahead of time, we have trained just one possible model. This model may turn out to be exceptionally good at a variety of tasks—we may, of course, get lucky—but we have no way of knowing how this model could be better. After all, loss curves are great, but they only really make sense in the context of a particular model and dataset. In other words, there is no general evaluation signal with this pipeline. Thus, the solution is clear: in order to improve, we should add an evaluation signal to our pipeline.
Iteration Two: Automated Model Evaluations
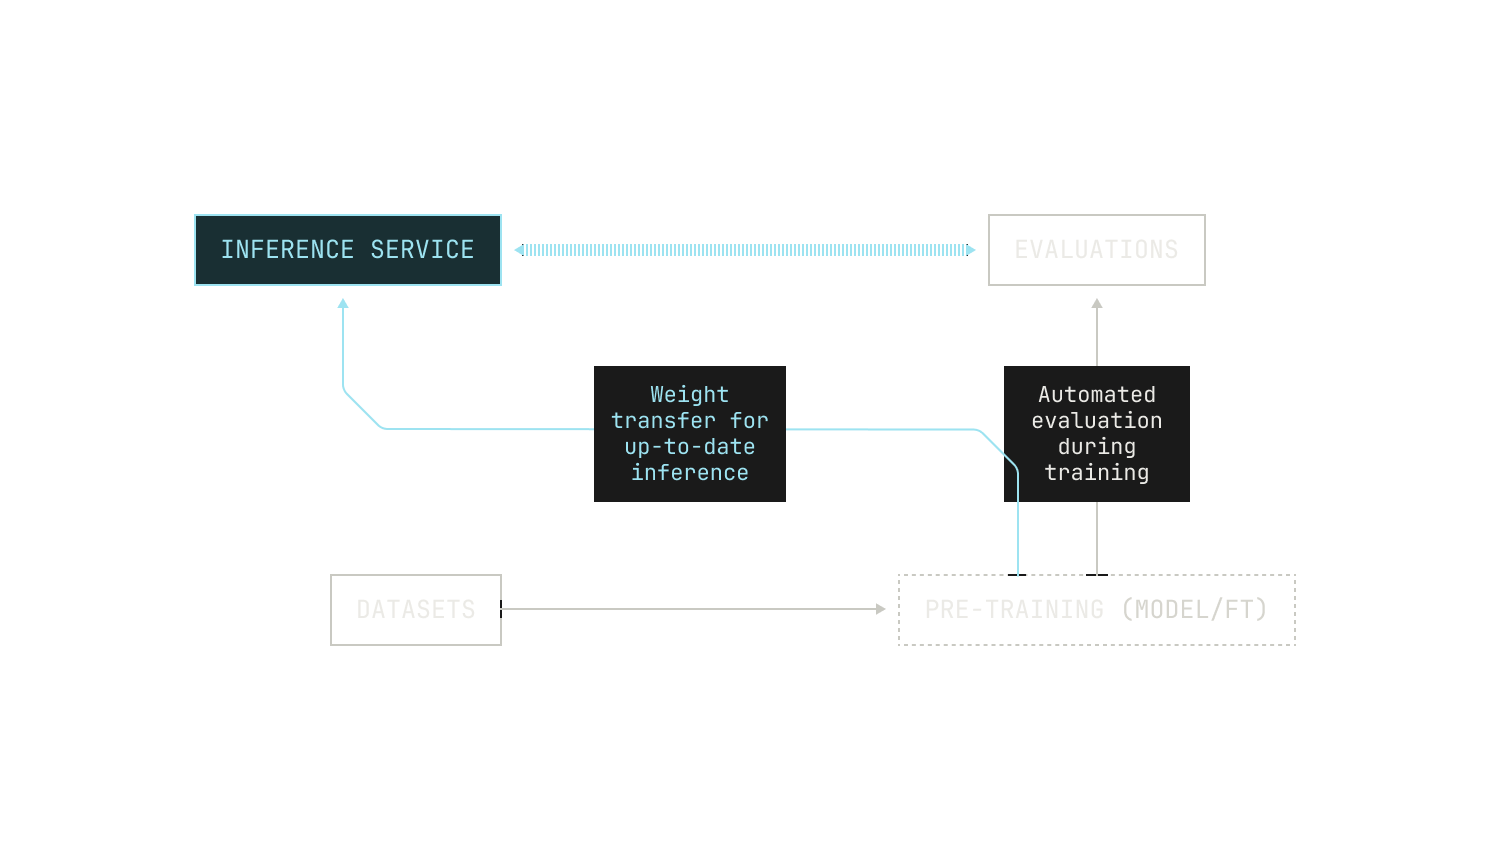
Let's take another look at the pipeline as it is now. The first thing we’re missing is a rigorous way to automatically evaluate the model's ability on certain downstream tasks. User feedback is certainly king, but it’s not suitable for pre-training scale insights. While there are many benchmarks available for evaluating the capabilities of foundation models, we don't need to decide on the evaluations themselves at this stage; we just need to introduce a way to evaluate our model at regular (adjustable) intervals. Ideally, we would also be able to adjust which evaluations we use for different training jobs. We can even go one step further and evaluate how the model's quality changes during pre-training, rather than just during fine tuning. With this in mind, our adjusted pipeline now looks something like this:
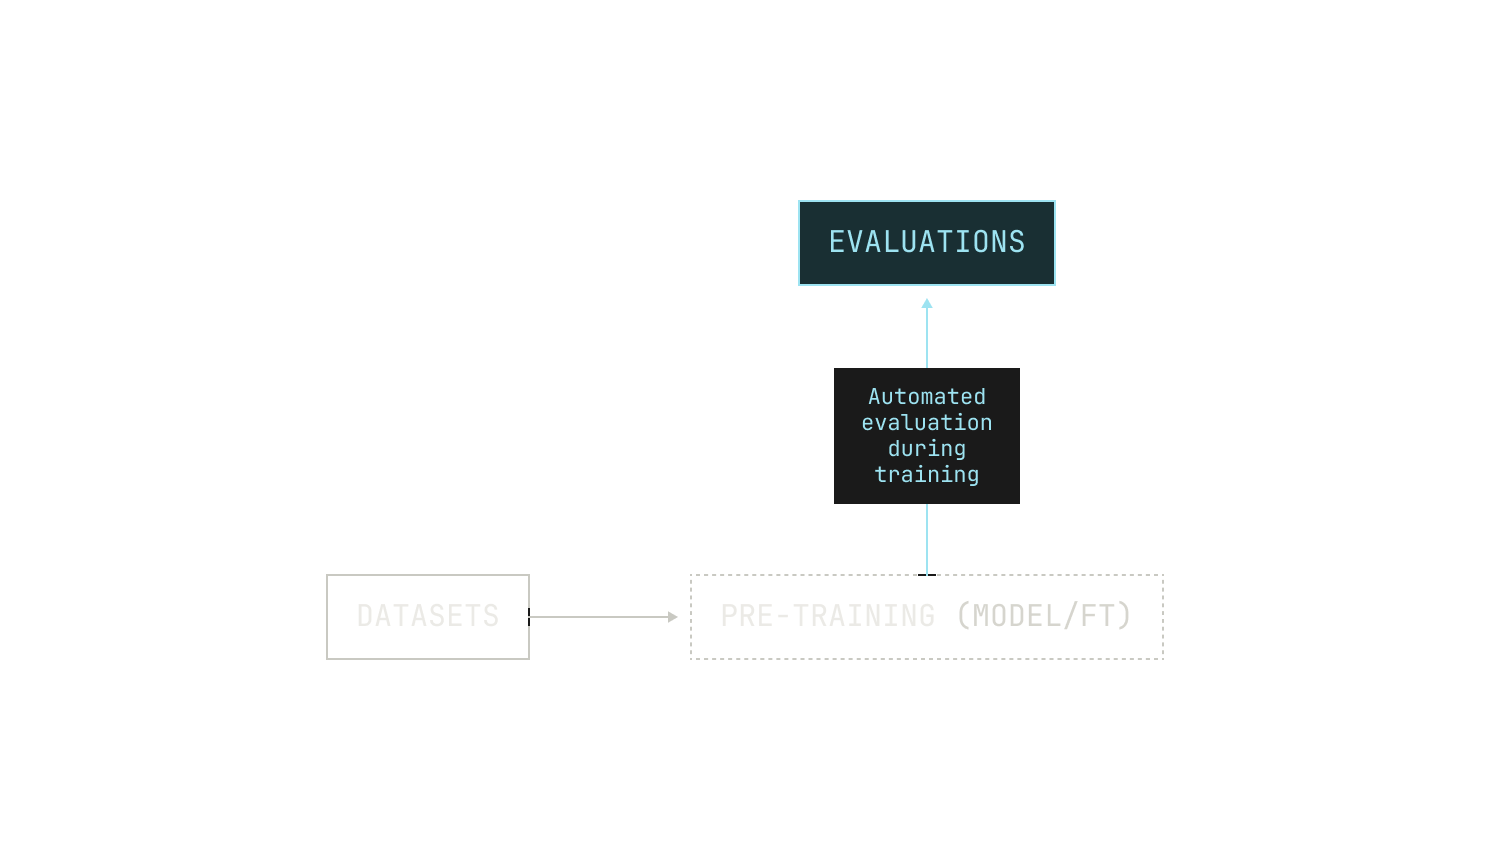
Running evaluations during pre-training also requires us to have an inference service that we can invoke during pre-training. This presents several technical constraints: for instance, we need to be able to transfer weights between nodes that are dedicated for training and those that we will use for inference. In the context of regular pre-training, we can get away with using a traditional checkpointing system but we will soon see that paying attention to the speed of this transfer is essential for more advanced training techniques.
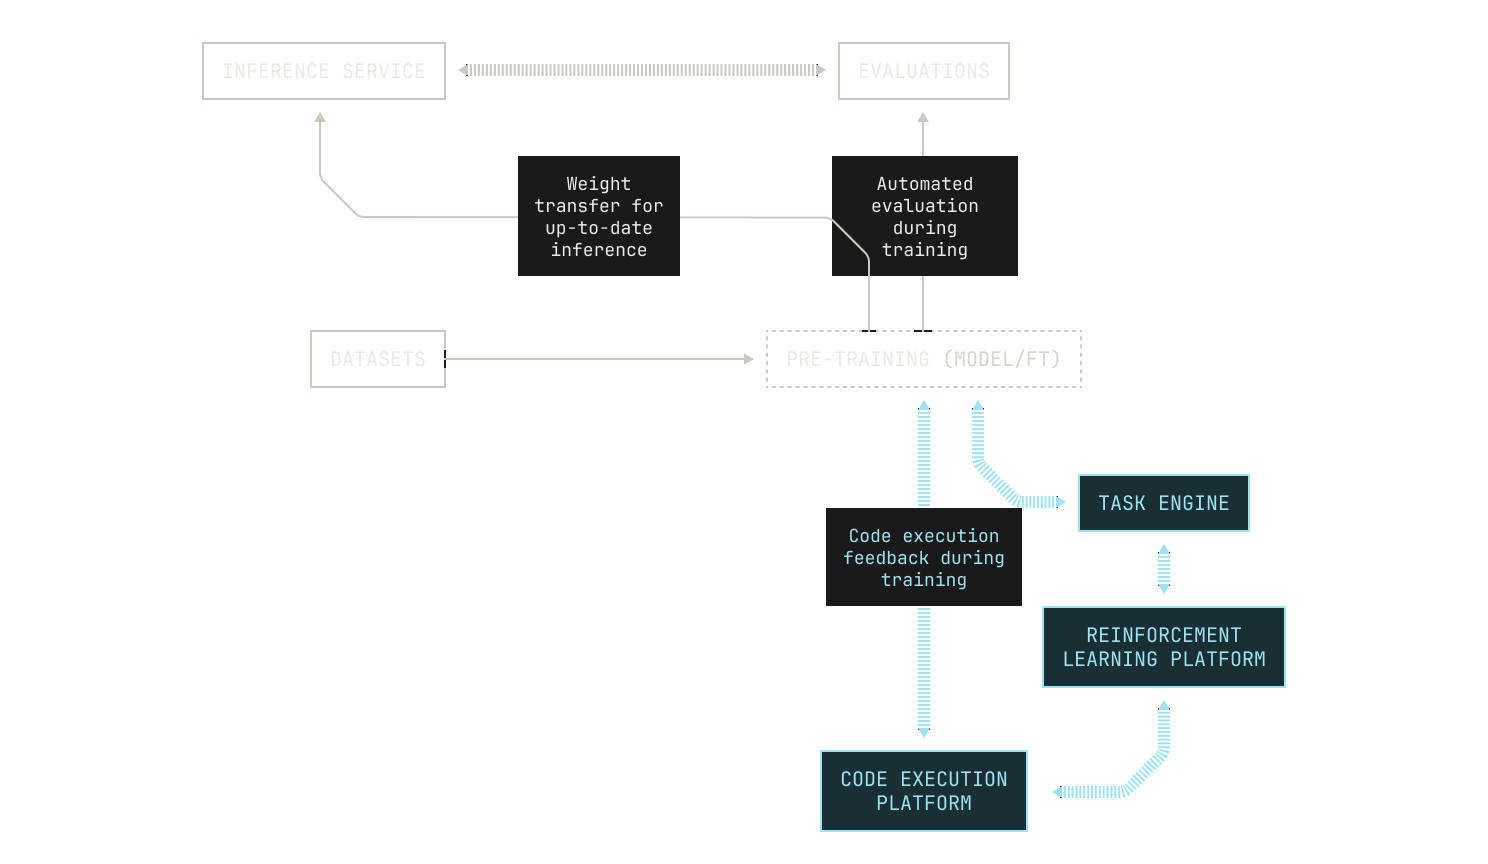
Iteration Three: Reinforcement Learning from Code Execution
Now that we have an evaluation system, we can think further about how we might improve our models. One of the ways that humans learn and grow is through external feedback. Similarly, we can improve our model's abilities by going beyond next-token prediction and using extensive reinforcement learning techniques that lie outside of typical approaches to fine tuning. This approach has required us to treat reinforcement learning as a primary concern, and we have now implemented a separate, modular reinforcement learning system that contains several reinforcement learning techniques (and allows for both synchronous and asynchronous reinforcement learning).
Our modular reinforcement learning system also includes several actor components that we can dynamically instantiate into our workflows. This has a direct benefit of allowing us to spin up new agents and rewards without modifying the surrounding machines in the Model Factory.
Additionally, we have also put a substantial amount of effort into building a secure and isolated code environment for our foundation models to self play and explore. This environment includes roughly a million public repositories (and most of their revisions) containerized with their test suite executable for us to use to improve our models. Tasks themselves are served to our reinforcement learning algorithms through a highly-scalable and dedicated task engine, enabling easy orchestration of millions of complicated agentic workflows in parallel. The task engine itself is highly versatile and suitable for use in online reinforcement learning workloads. By combining the task engine with our code execution environment, we are able to teach agentic workflows to handle real-world software development.
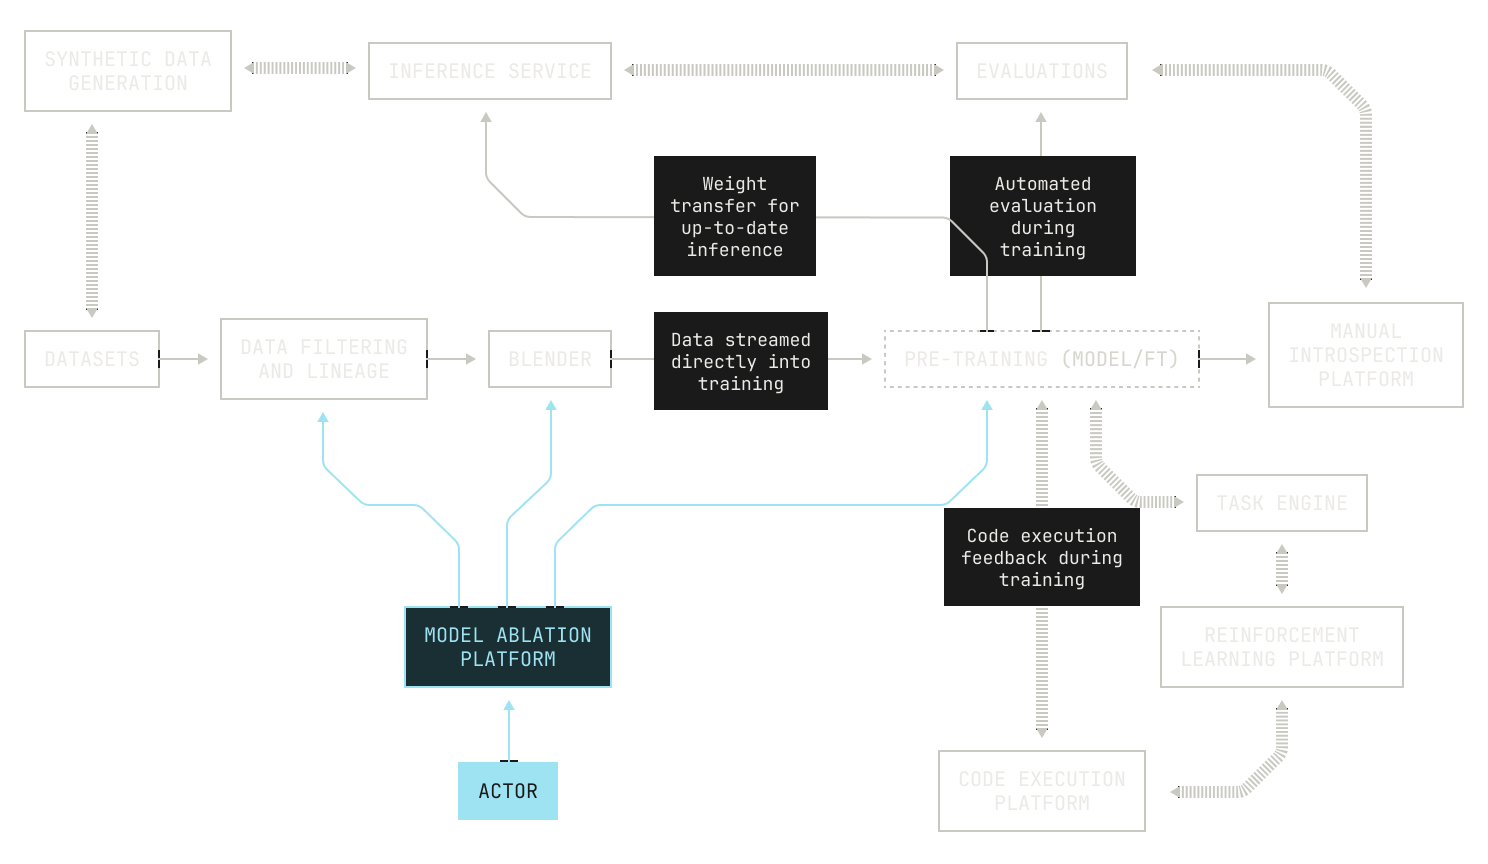
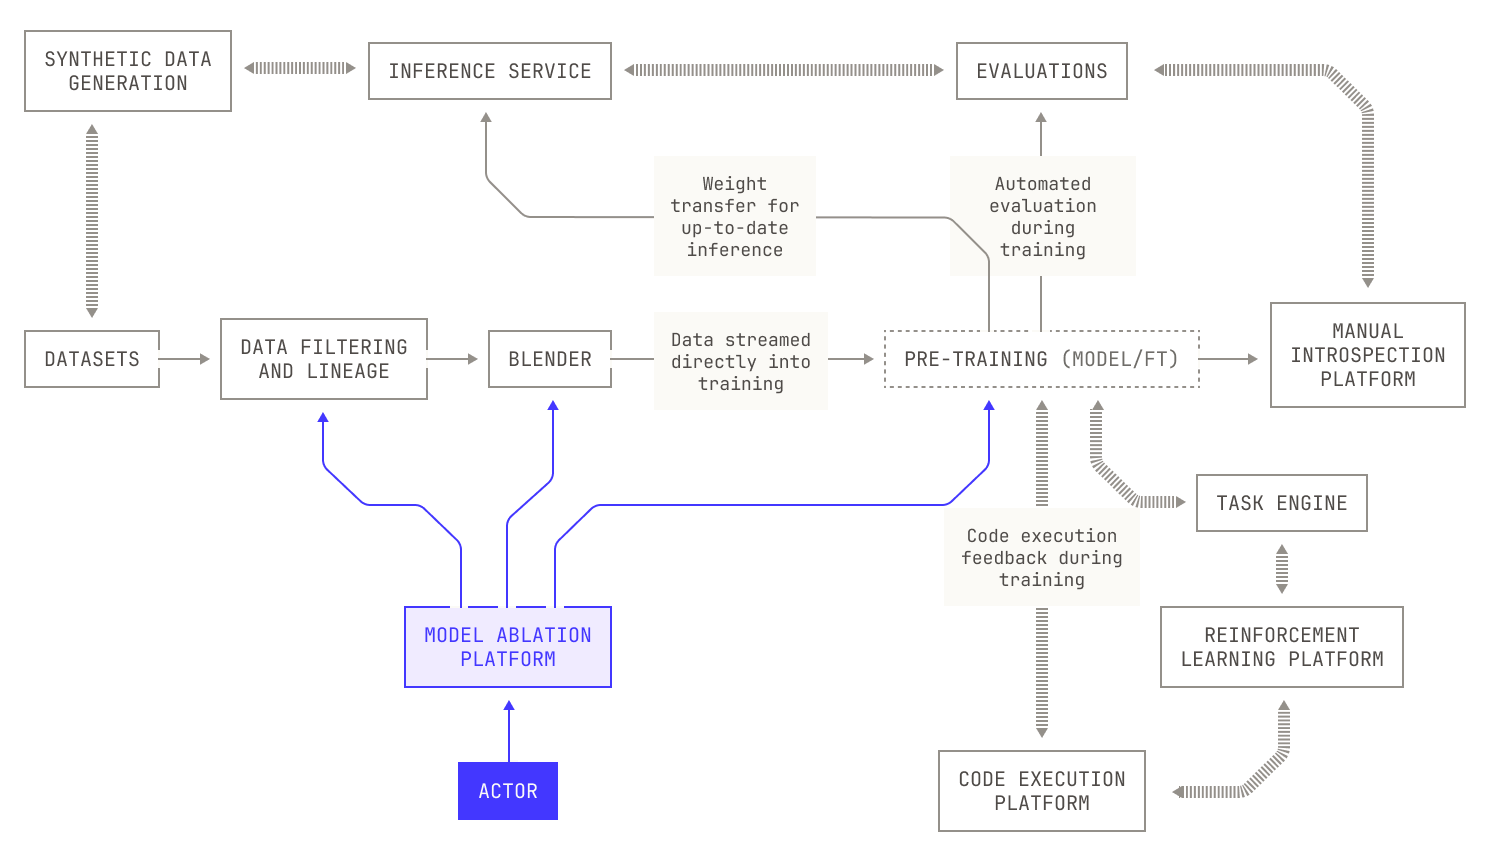
Iteration Four: Automated Architecture Ablations
We can now turn our attention to how we experiment with model architectures. It’s clear that experimenting with architecture will lead to changes in model performance. After all, a model's architecture will strongly influence how it performs at a given task. However, varying the model's architecture comes with some tough choices. On the one hand, not all aspects of a model are dictated solely by technical performance: for example, small models can provide low latency inference across massive context lengths, but at the cost of performing poorly compared to larger models. Yet these requirements are actually a gift, as they allow us to constrain an otherwise unbounded search space. What's more, we still have a huge search space to explore across model layouts, parameter sizes, layers and so on. We can even consider novel architectures, like hybrids between transformers and linear attention variants. If you can imagine a tweak, we can efficiently try it with the Factory. But there’s still the elephant in the room: experimentation with large language models is an incredibly time consuming and costly endeavour. In order to optimize the usage of our GPU cluster, we will need to consider every possible optimization and observability technique during pre-training. Thankfully, we’ve collected a huge bag of tricks at Poolside for optimizing our pre-training codebase. We also make use of several techniques that allow us to experiment on small models in order to predict their scale-up performance, such as mu-P.
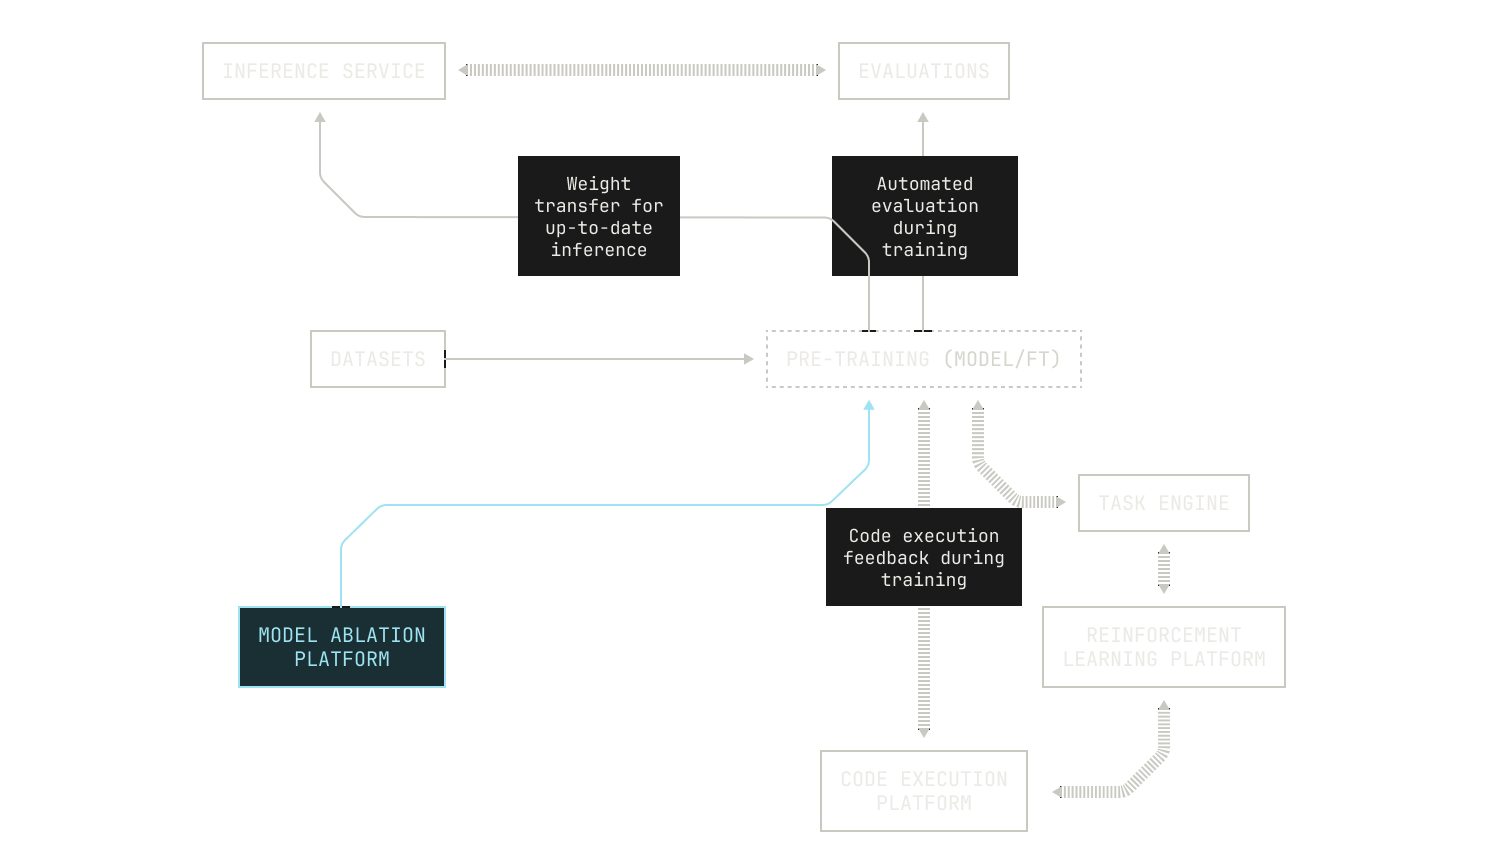
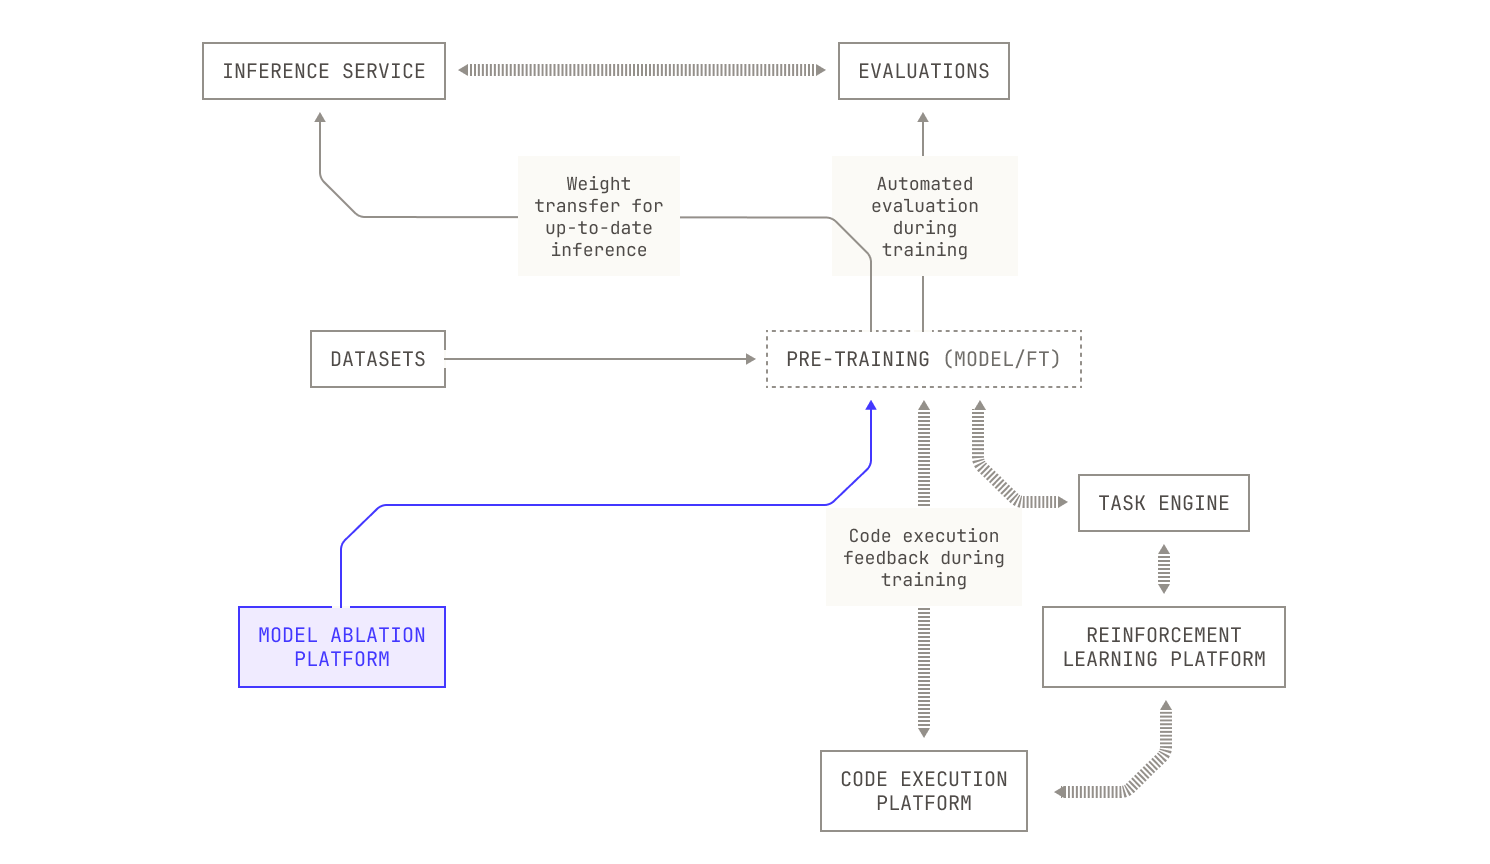
At this stage it’s worth discussing how we might handle the huge complexity of scheduling all of this additional work on a fixed-size cluster of GPUs. At first glance it may appear that we can simply schedule jobs arbitrarily across our GPUs using a preexisting scheduler, like SLURM. However, this is actually insufficient for our setting because we now have dependencies between tasks: our evaluations framework requires access to inference, which needs to wait for a checkpoint to be produced by the model currently undergoing pre-training. In order to manage this complexity, we designed and implemented a single Kubernetes orchestrator that handles all of these moving pieces in a consistent and rigorous way. As a side benefit, we can use such an orchestrator to schedule additional, useful tasks when GPUs are idle, such as synthetic data generation.
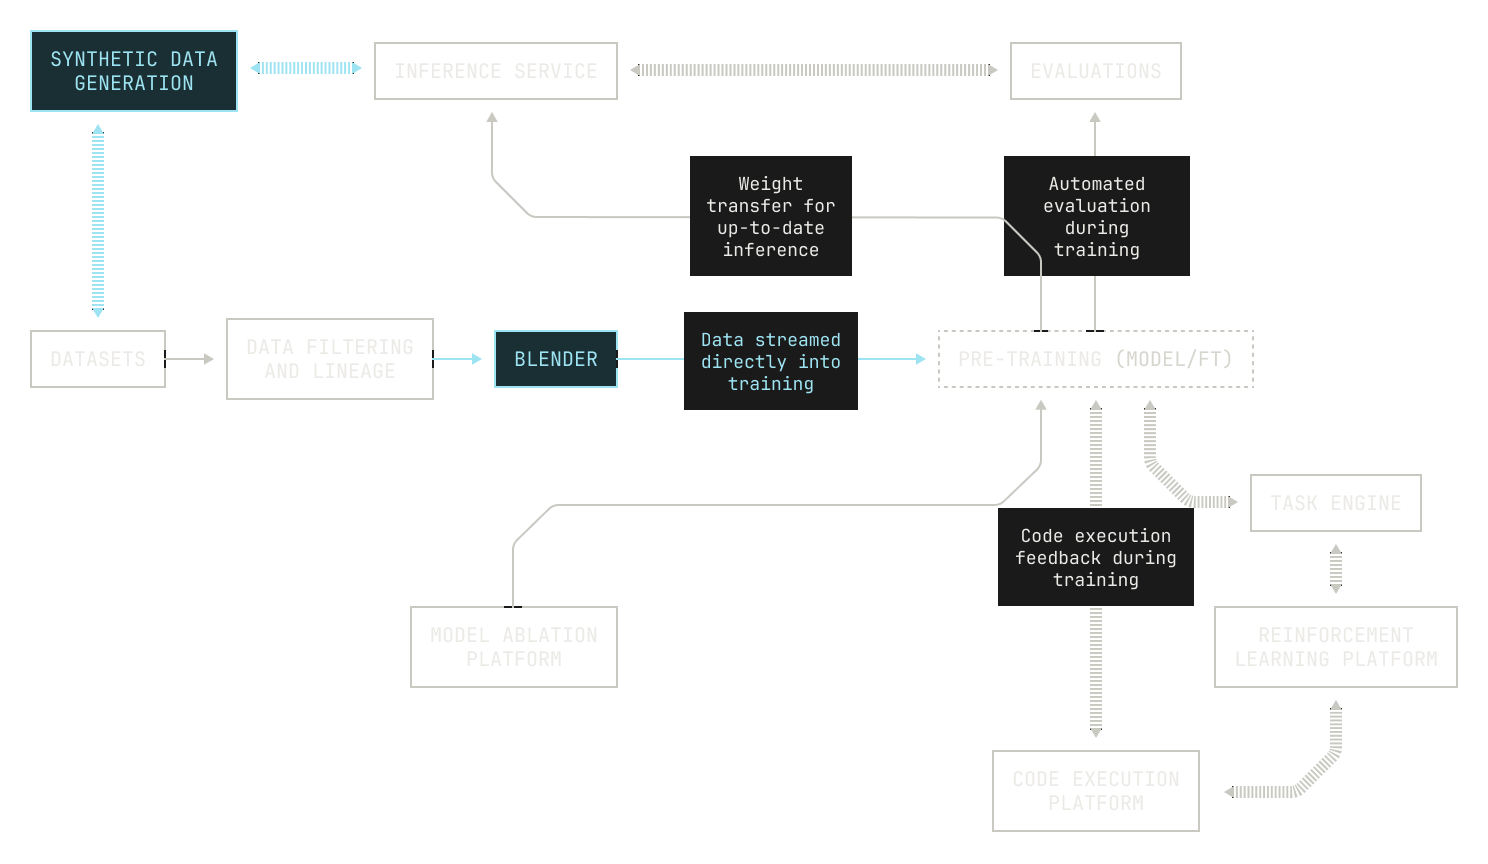
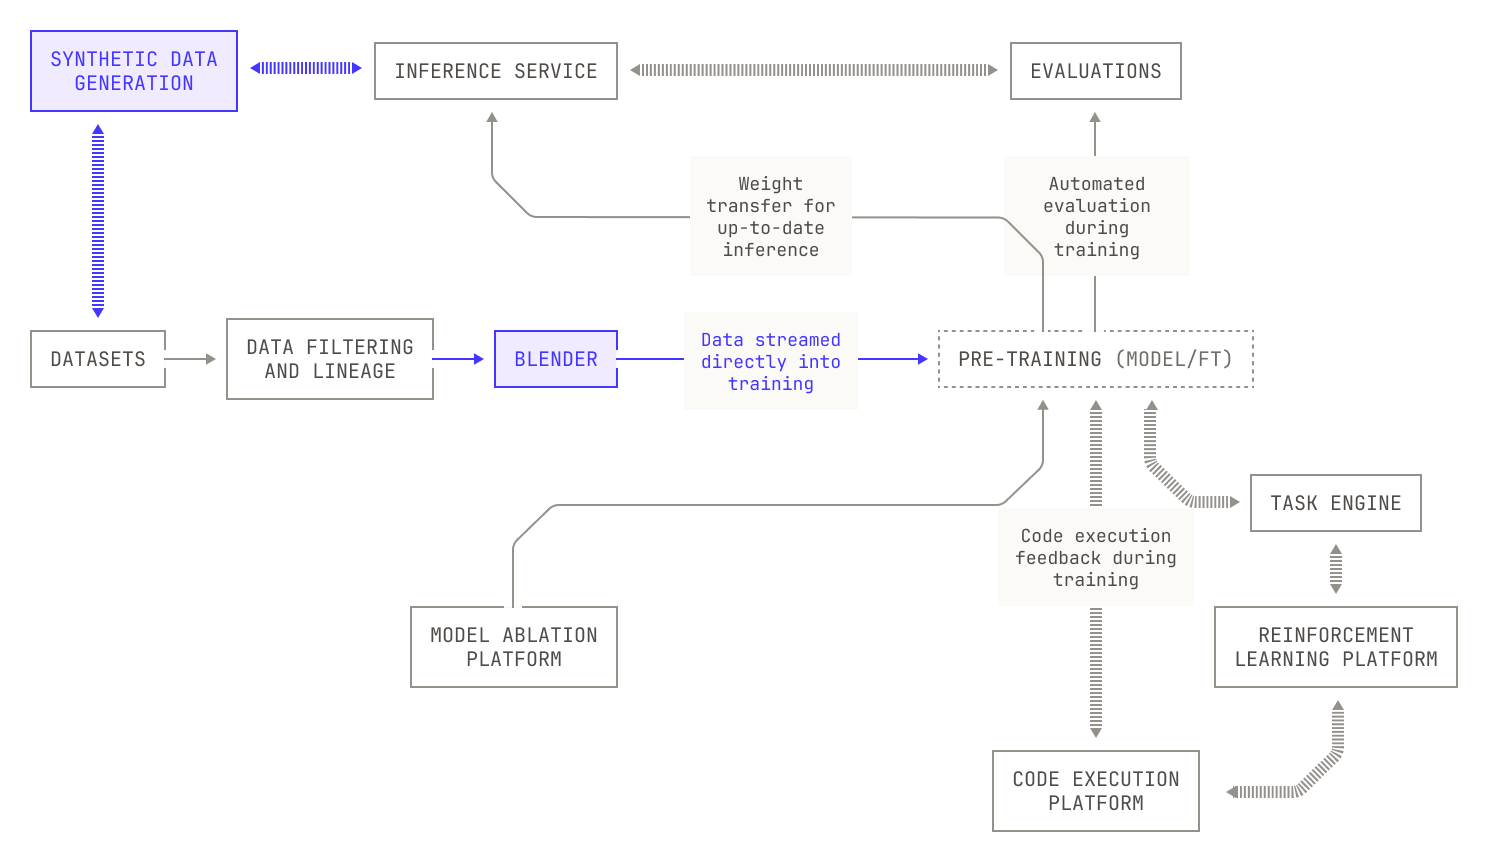
Iteration Five: Automated Data Refinement
Looking back, we can see that there is one untouched piece of the original pipeline: the initial dataset. Much like raw materials in a real factory, the output of our Model Factory depends heavily on the quality and quantity data that we feed into our machines. On the one hand, it’s well known that AI models are orders of magnitude less efficient at learning than humans, and we typically need to train on trillions of tokens to see the emergence of latent abilities. However, wantonly training on trillions of tokens is not a recipe for success; after all, no one has ever learned to code by reading Great Expectations. Instead, we also need to make sure that our model sees enough well-mixed, high quality data during pre-training. This is further complicated by the fact that while data cleaning and refining techniques are well understood, it’s often difficult to understand the interactions between different data refinement steps and downstream performance. Put differently, what we really need is a form of lineage across our dataset refinements, the ability to link lineage back to model performance and large scale semi-automated experimentation.
There are also other practical concerns when it comes to the roles of our data pipelines. On the one hand, the sheer quantity of data needed for pre-training necessitates that we pay careful attention to the speed of ingestion and processing. Frankly speaking, using a slow or unscalable approach would be so disastrous to training performance that we might never actually get around to evaluating a new idea. Equally, poor quality data ingestion can massively harm the ability of a foundation model to generalise and perform; an ingestion pipeline must not only be fast, it must also be as accurate as possible. On the flip side, we regularly need to generate hundreds of billions of new synthetic data tokens, as well as ingest, re-ingest and rewrite large parts of pre-existing web data, requiring us to process massive amounts of data. Yet, as we’ve already built an inference engine in our Factory, we can simply add a synthetic data generation machine and connect it to the inference engine.
Iteration Six: Automated Data Mixing
Now that we’ve produced the relevant datasets, we also need a way of evaluating how these datasets should be mixed together and supplied to the model. We can, of course, simply shuffle the data for training, but we also need a clever way of determining what the data blend should be, as well as the order in which the data is delivered. This all adds up to multiple new components in our Factory. A further concern is that data is typically supplied in training as a single, massive dataset, making it difficult to adjust for mistakes or changes in scope. Additionally, supplying such a dataset introduces many practical concerns that make training difficult. For instance, materialising a single dataset requires us to fix our cluster size ahead of time; and training is delayed until the entire dataset has been produced. Moreover, the cost of simply distributing a singular massive dataset across a GPU cluster—and the cost of re-materializing—is a substantial barrier to efficient training. From an experimentation perspective, serializing said dataset also couples the data blend and data order to the dataset, necessitating that we redistribute the dataset each time we run an experiment with a new blend configuration. We address these issues by instead streaming data into training from our upstream data source, allowing us to easily change data mixes or quantities spontaneously across different experiments and even live during model training.
Now that we have all of the building blocks in place, we’re at the point where we can actually build models. However, training models is still a long and tricky process, and we still need to provide some form of observability to our Factory. We achieve this observability by adding dashboards and dials to the machines in our Factory, streaming a large number of metrics to various dashboard services. This approach allows us to keep an eye on everything to do with model training, from loss curves to iteration time and everything in between. We also capture a large number of production metrics, enabling us to ensure that changes made to the Factory itself are both stable and beneficial.
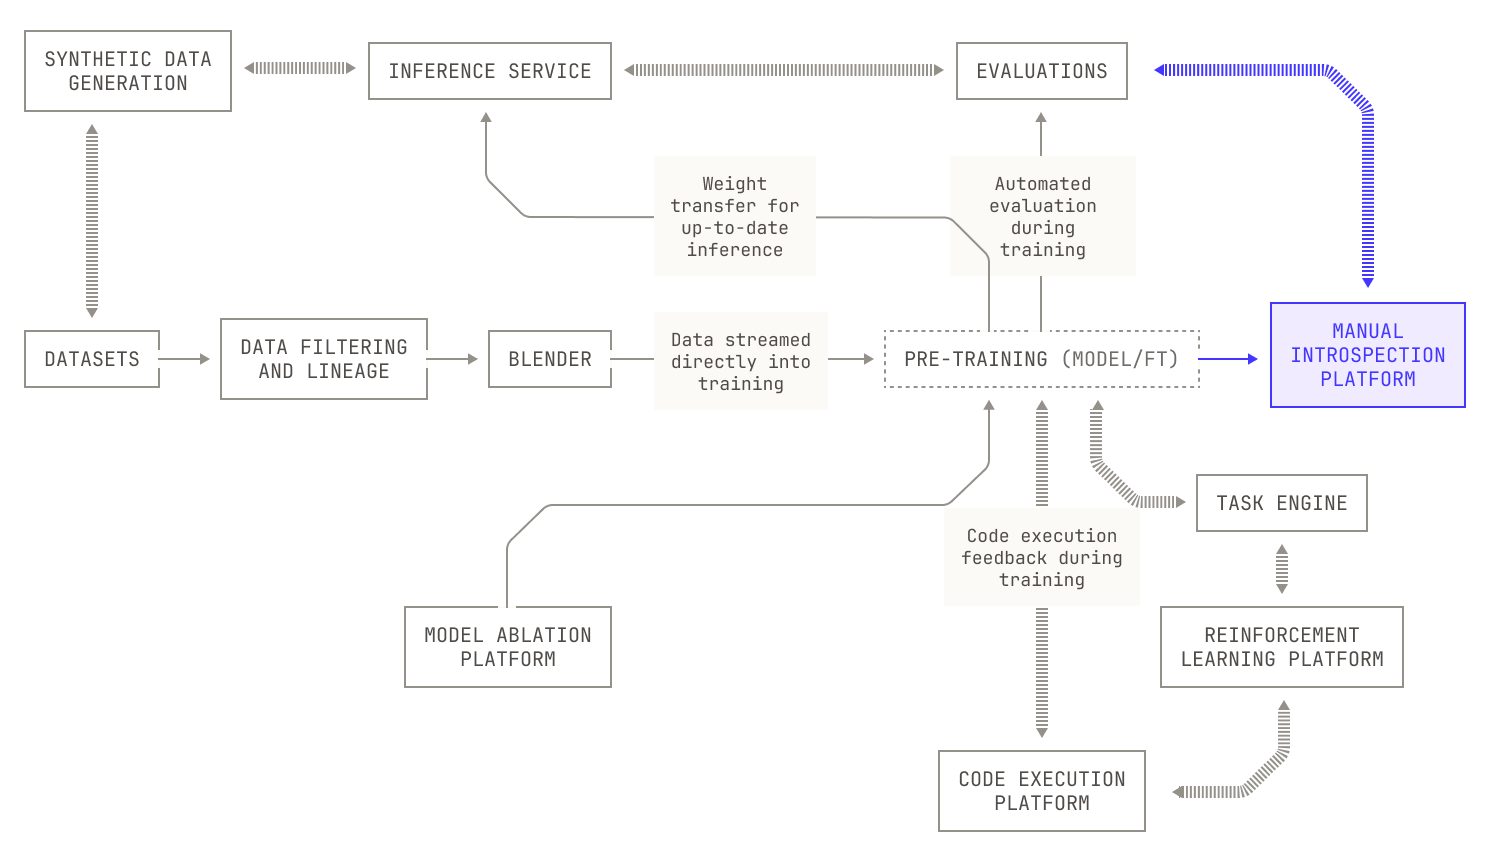
We also need a way of doing some form of quality assurance (i.e. vibe checking) on the models that come out of our Factory. This sort of quality assurance goes beyond automated evaluation: we want to manually try and verify each and every model that comes off the production line. We do this by adding an additional verification platform that deploys freshly produced models to our inference service, allowing us to stress test produced models in our daily working lives.
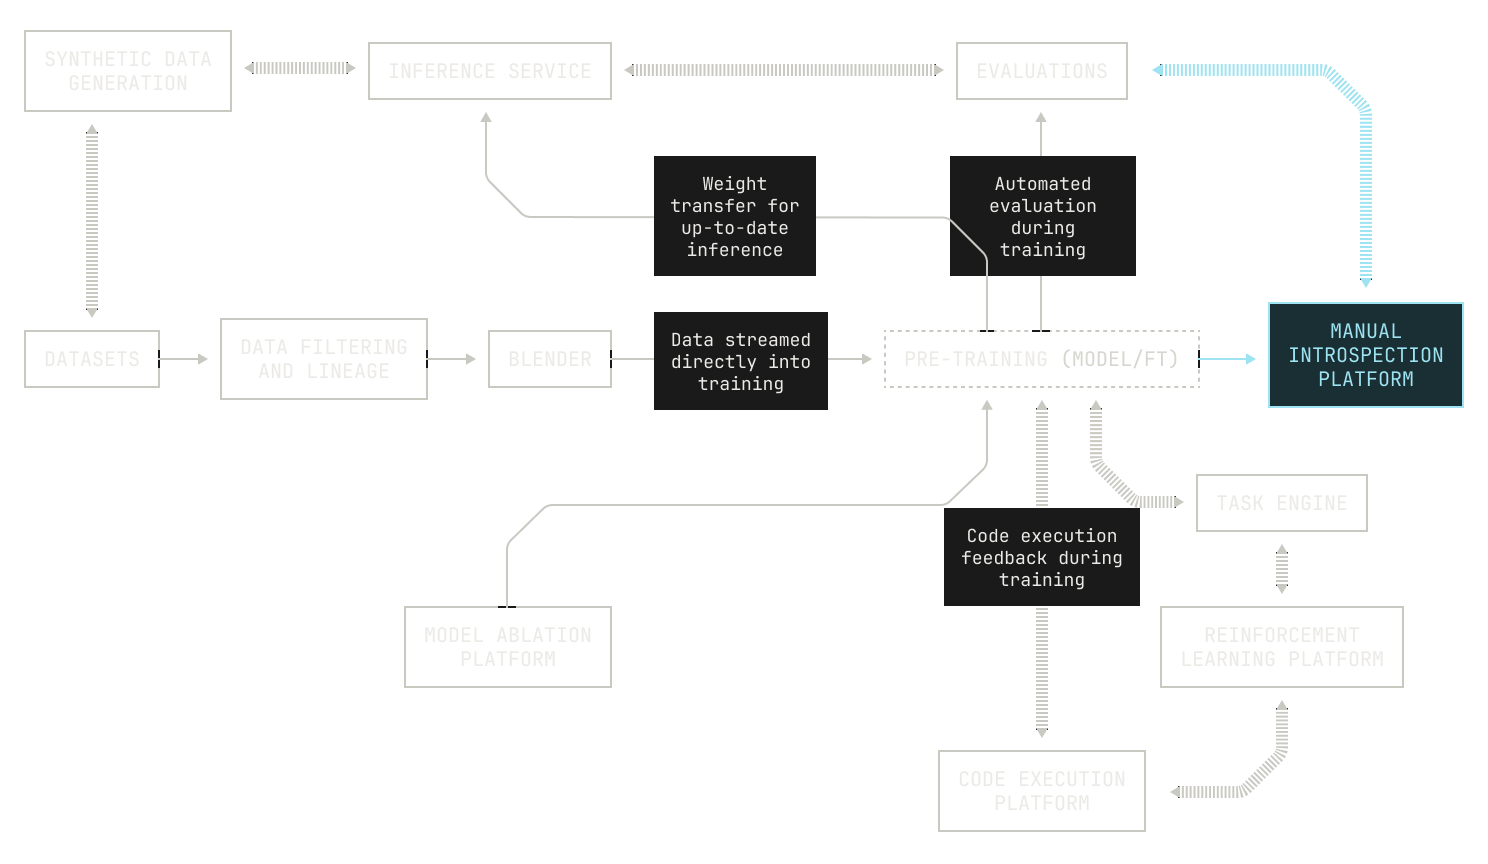
There is one, final thing to discuss about the Model Factory: namely, automation. We’ve added a considerable amount of efficiency when it comes to building new AI models, but if this effort requires substantially more engineering time, it will all have been for nothing. In order to handle this complexity, we represent our data and architectural experiments as programmatic assets. Concretely, we manifest our changes to data refinement and model architecture as structured experiment files that are automatically queued and executed by the orchestrator. Following this approach gives us two key benefits. On the one hand, by representing configurations as code, we gain the ability to fully reproduce experimental results in a rigorous fashion. Secondly, this approach leads to an extremely quick feedback loop. Scheduling a new sweep, for instance, such as over batch size or learning rates, takes fewer than ten minutes, as opposed to days. This reduces the friction of trying out new ideas, making it easier for us to move new innovations into production.
What does the Model Factory actually give us?
We can now begin to think about what this pipeline gives us beyond what we have already discussed. First, notice that the subsystems in this pipeline are rather uncoupled, and thus each subsystem can be arbitrarily complicated. This decoupling is extremely useful in practice: we can, for instance, adapt or modify the data pipelines without needing to adjust the rest of the Factory in any way. In a similar vein, we can adjust data mixes, model architectures, or fine tuning techniques at will, without needing to adjust anything else. This enables us to handle the combinatorial complexity of building foundation models. By simply adapting a single piece of the Factory, we can suddenly explore new component mixes and architectures. Lastly, we note that the pipeline described above is fully modular, allowing for meta strategies when it comes to training models. For instance, we may wish to vary the amount of fine tuning that we use on a particular model. In other words our ensemble of machines can be altered at will, enabling us to be purely pragmatic and experiment-driven. We can even insert additional machines or systems as we need them, allowing the factory to grow almost at will, further handling and supporting our needs.
It’s hard to overstate the impact the Model Factory has had on our ability to operate at the frontier of AI. Our previous deduplication efforts, for instance, used to take over a week’s worth of engineering time to schedule and run; now, we can deduplicate datasets effortlessly with the click of a button. Experiments that used to take weeks to organise and schedule are now handled by the orchestrator in under an hour—often as few as ten minutes, unlocking a new level of productivity for our team. Qualitatively speaking, we’ve also noticed that the Factory allows for a far nicer developer experience compared to our previous pipelines, making it much easier to onboard new engineers.
Above all, the Factory gives us a huge amount of leverage to rapidly try out new ideas and build new foundation models. Instead of waiting all week for results, we conduct supercomputer-scale experiments over a weekend. Instead of manually triggering pipeline steps, we can simply describe an experimental configuration and the Factory handles everything else for us, even triggering new steps automatically.
What does the Model Factory look like in practice?
Now that we have a good overview of how the Model Factory works in theory, we can begin to look at how we actually built it at Poolside. We'll do a deeper dive in future posts, so for now let’s stick to the high-level details.
High-level layout of the Model Factory
In practice, the Model Factory can be viewed as several systems stacked under a single Kubernetes orchestrator. The orchestrator is responsible for deploying and prioritising jobs across our 10K H200 GPU cluster. This process, it turns out, requires the building of several additional constraints and handling. For instance, some parts of our data pipelines (such as deduplication) do not actually require GPUs to run successfully; indeed, we can run them entirely on CPU nodes, saving our precious GPUs for other tasks. In order to do this, we extended our orchestrator to handle multiple different types of node pools, allowing us to easily schedule certain tasks on different types of nodes. We note, of course, that the Factory’s design is broadly agnostic to the underlying accelerator that is used, and the exact number of GPUs or nodes can be adjusted at will without changing the underlying ideas. The deployment of the Factory to the cluster is fully automated using Helm charts, with Terraform being used to manage the cluster itself.
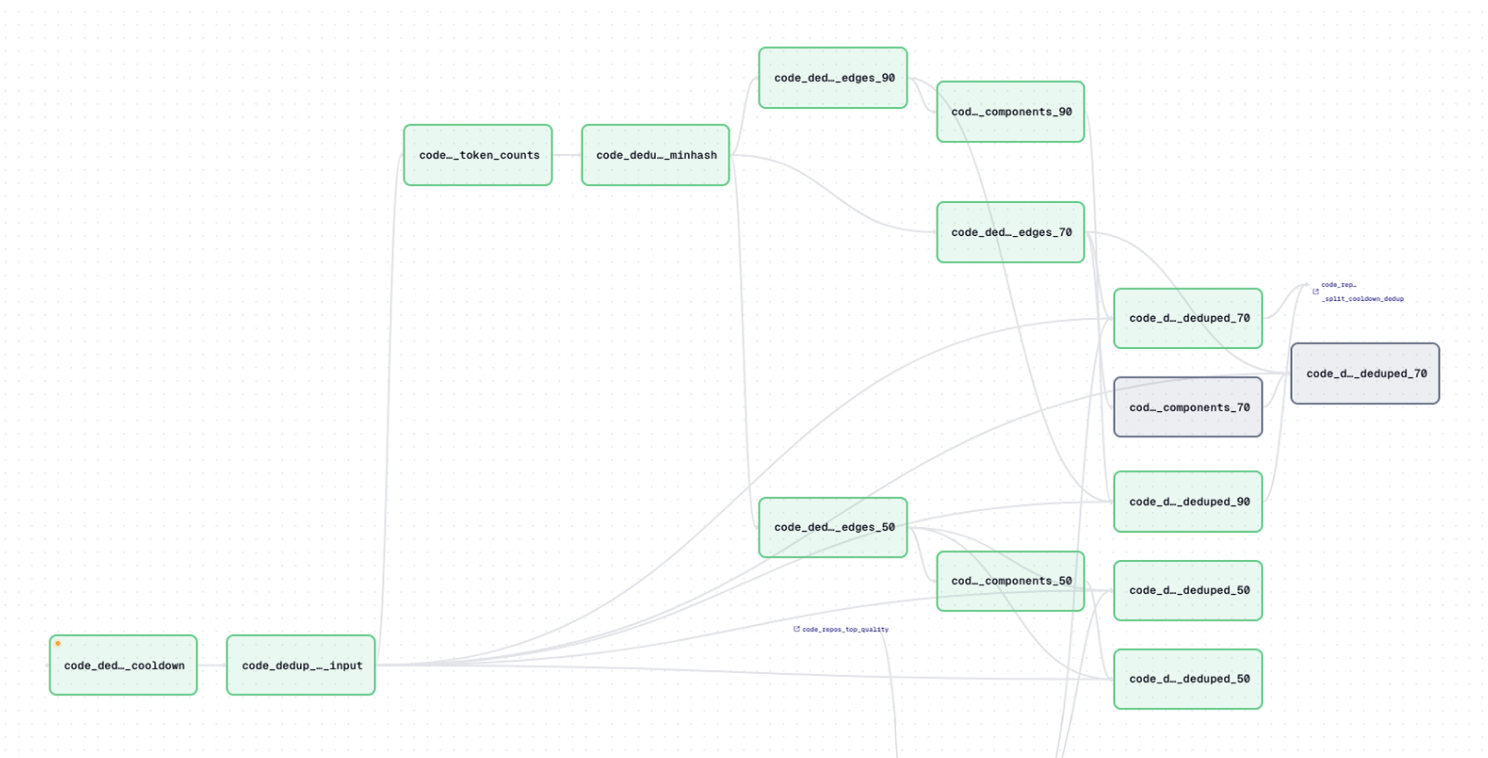
Now that we have an orchestrator, we need to think about how our experiments are structured. As previously mentioned, all of our experiments (for both data processing and architecture) are codified (i.e. every change to either model architecture or data processing steps is represented as a piece of versioned code). Concretely, we write all data experiments as Spark data frames, providing effortless scalability across all of our data experiments. In contrast, our model architecture experiments are typically specified as Python dictionaries that are then programmatically validated and converted into structured Markdown files. This conversion enables us to easily extend previous experiments in new directions—we simply need to extend an existing dictionary to cover new parameters. In both cases, once an experiment is defined it is immediately deployed as part of our continuous integration workflows.
Other than providing a seamless way to work, executing experiments as part of continuous integration also provides a huge level of reproducibility: after all, we can recreate the experiment by simply re-triggering the job. Lastly, for data experiments in particular, we can manifest the resulting data as assets in an Iceberg data lake, providing easy versioning and reliability, which is critical for machine-learning research and implementation.
Dataset management
Crucially, Iceberg tables also allow us to query any retained version of any data asset, complete with full metadata and lineage. In fact, any Engine in the Factory that is Apache Iceberg-compatible can also query data assets, enabling powerful automatic workflows. In practice, we query our Iceberg tables by using Starburst’s SQL capabilities, allowing us to easily visualize and inspect the results of our queries.
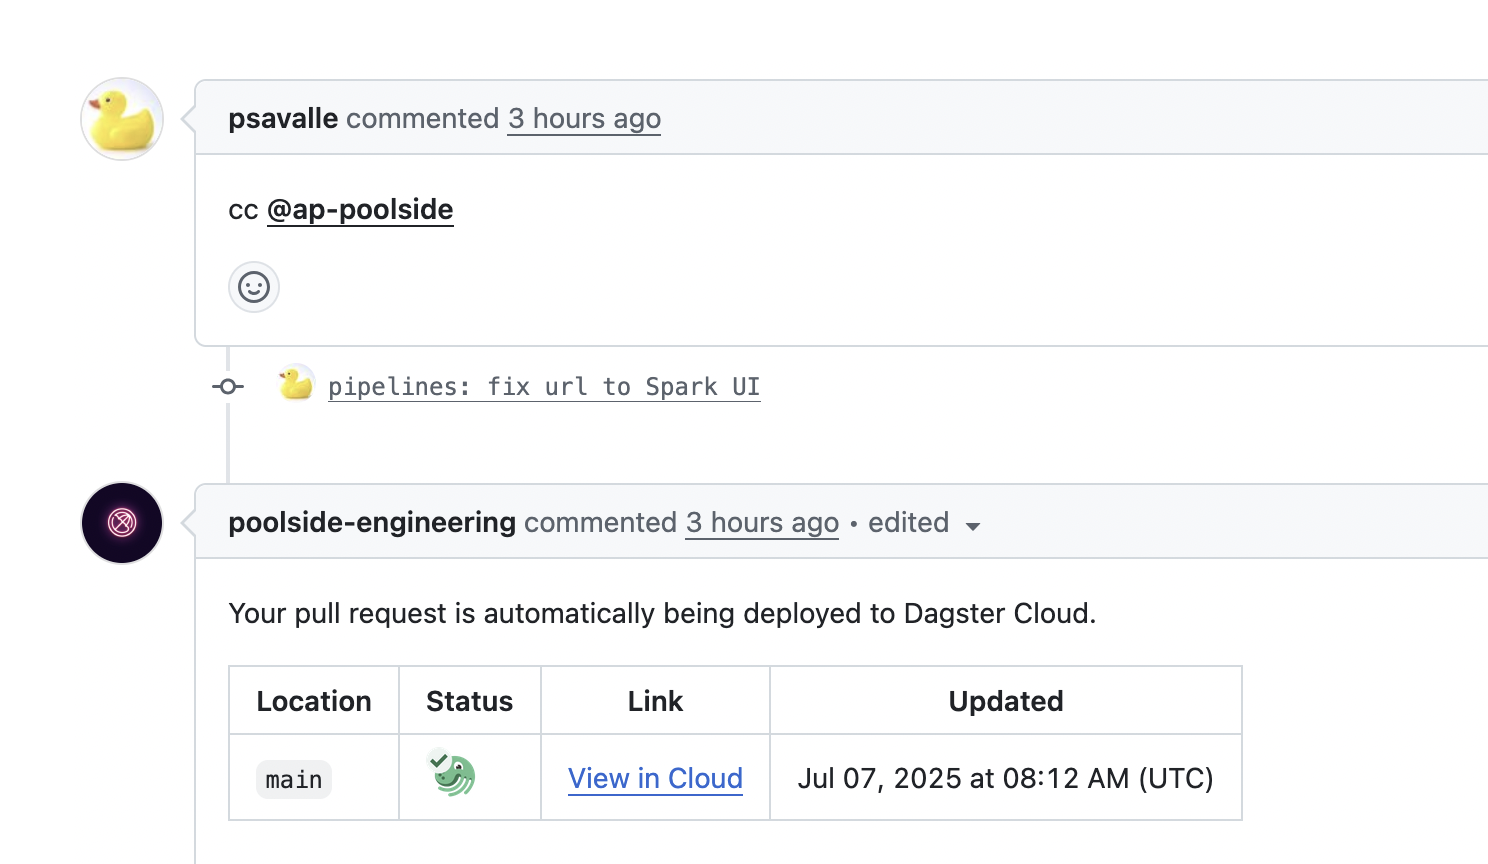
At this stage, it’s worth mentioning that training runs typically consume hundreds of data assets, with each asset representing a full dataset. We achieve this by using the Dagster platform, which acts as the beating heart of the Model Factory. Dagster provides an easy way to orchestrate different data pipeline steps and model training. Additionally, Dagster also allows us to conditionally run code on produced assets, which in turn allows us to quickly check and exclude a certain dataset if the quality is too low, or if data packing was otherwise inefficient. More generally, Dagster also enables us to launch training runs directly from the web-UI and to specify automatic sub-steps during training, such as offloading checkpoints into inference or triggering evaluations during our workflow. These changes are incredibly easy to make: we simply need to provide a corresponding configuration file. We can even use Dagster to quickly branch on existing assets and workflows, automatically launch new workflows according to either a pre-existing schedule or during other workflows, and visualize the results of existing experiments.
One indispensable area of Dagster’s automatic job launching is our evaluations workflow. Instead of manually triggering evaluations, we configure evaluations to be launched on an experiment-by-experiment basis. These evaluations are typically executed automatically every 100-1000 training steps, with the exact value set in the experiment’s config file.
We typically run a variety of evaluations against benchmarks that are indicative of general foundation model capabilities, ranging from general knowledge and reasoning capabilities to ability at coding-specific tasks, with all results automatically stored and reported. Crucially, because evaluations are a somewhat lightweight inference workload, we allow evaluation workflows to either be pre-empted in favor of long running jobs, or prioritized in order to provide even faster feedback loops.
Measure all the things
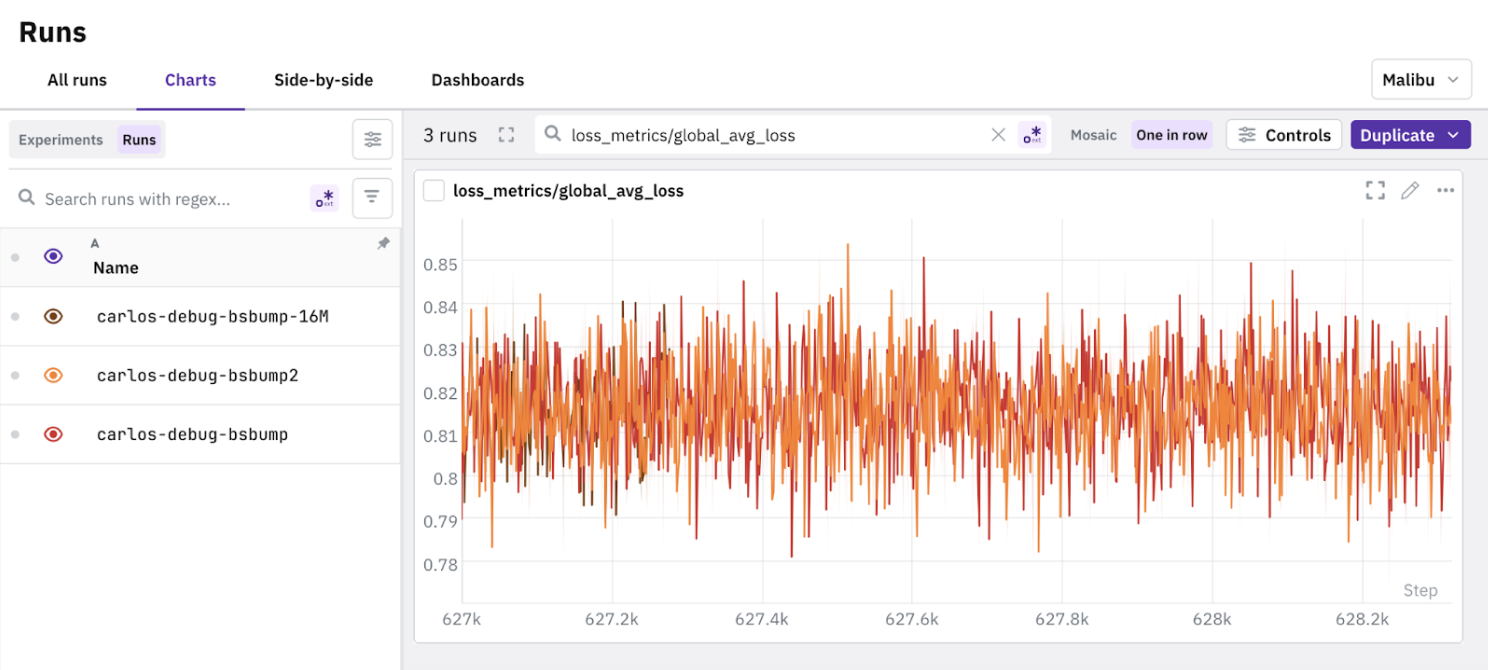
As previously mentioned, we capture a huge quantity of metrics across our Model Factory. On the one hand, we typically stream training metrics—loss curves, gradients, evaluations—into the Neptune data platform. Crucially, Neptune allows us to compare metrics across different runs of the Factory, which gives us much deeper insights into how our ideas play out in practice during training. However, training metrics only go so far, and the proof is very much in the pudding when it comes to model quality. To enable us to more easily introspect produced models, our team built a suite of internal tools, collectively called Podium. Podium allows us to manually query and interact with models, compare models against each other with evaluations, and interact with diverse fine-tuning datasets for further model improvement. We stress that model evaluation—or "vibe checking"—is a company-wide effort at Poolside; everyone, from engineers to members of the go-to-market team, regularly provide feedback on models that come off the Model Factory's production line. This feedback really helps us to train models that are better than we could otherwise achieve by simply chasing better metrics alone.
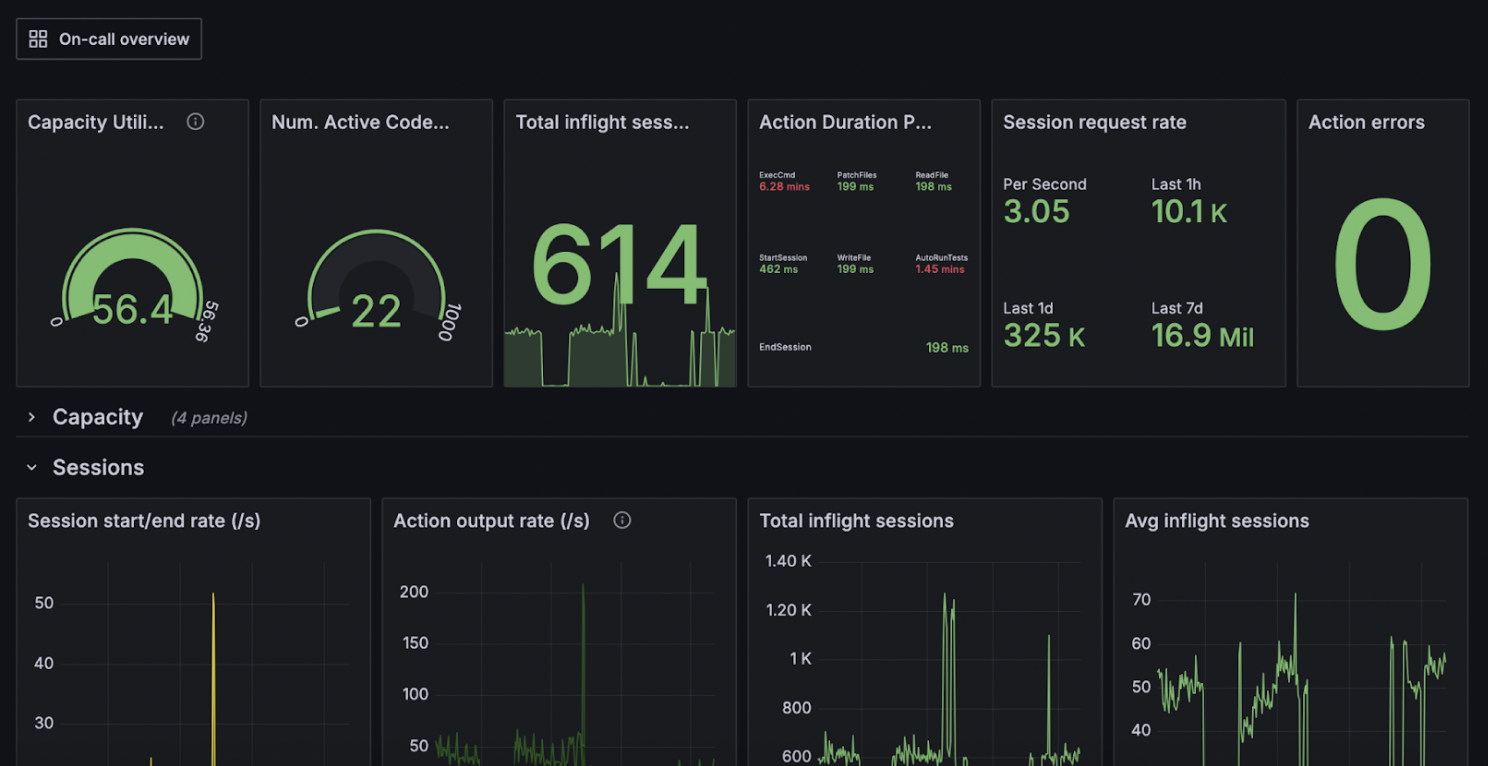
On the other hand, we also capture production metrics for all of the sub-systems in the Factory and stream the results into a series of Grafana dashboards. In contrast to our Neptune metrics, our Grafana metrics are typically focused on the reliability and performance of the systems in the Factory, and not the models that are being trained. These metrics serve as useful bellweathers for changes; we can directly check how new ideas or tweaks impact the running of the Factory in practice. In the past, these Grafana metrics have been crucial in helping us to diagnose issues with new techniques, as well as helping us to identify failing nodes.
Pre-training at scale
Moving on from evaluations, we land on our pre-training codebase, Titan. Titan is a state-of-the-art pre-training library based on PyTorch. Similar to other leading training frameworks, Titan is equipped with many low-level tweaks to ensure peak performance, along with additional observability tools that are not commonly found in public pre-training codebases. On the performance front, we make substantial use of PyTorch's “torch.compile” feature to ensure that our auto-generated kernels are sufficiently efficient, and we also make heavy use of Triton and CUDA kernels where necessary. In addition, Titan provides the exceptionally useful feature of being embedded deeply inside our inference codebase, Atlas. This design decision enables us to quickly move new model architectures into production, as we can always ensure that we have a close match between our inference implementation and our training implementation. In fact, we typically task the Model Factory with automatically checking this equivalence for us during experiments, leaving us to focus on the low-level optimisations necessary for peak performance. Atlas itself is a large wrapper library around other popular inference libraries. We note that Atlas serves multiple different workloads—evaluations, customer inference in production, pre-training experiments—across a wide range of hardware platforms. Indeed, Atlas runs natively on NVIDIA, AMD and Trainium accelerators, giving us a large deal of choice when it comes to deployment.
Practically speaking, we either schedule an inference task as a dedicated job—requiring a fixed number of nodes in our cluster—or as an elastic task that scales up and down on demand. This automatic scaling both ensures that our GPUs are never idle, and that important experiments are not blocked by lower priority tasks.
Code execution at scale
We now turn our attention to our code execution platform. Our code execution platform provides a secure and isolated environment for models to solve tasks by writing and executing code. In order to provide such an environment for our models, we’ve built a platform that automatically builds GitHub repositories inside OCI containers, with the exact build mechanism depending on a series of heuristics. In practice, we build containers depending on a series of heuristic rules, with build tasks scheduled on an arbitrarily-sized node pool. We also use a robust observability system for reporting build failures, enabling us to further refine, debug, and improve our build heuristics. In terms of scale, our code execution environment contains around a million repositories (and many of their revisions) across many different programming languages, and we constantly add and build new repositories into the environment. We stress that the process of building containers is constantly evolving, and we have recently seen a huge amount of success from using agent-based building. This is a particularly exciting step for us, as an agent built using the Factory is now working to improve the Factory that built it. More broadly, our code execution platform also serves as a core component in our model evaluations, providing a strong feedback signal for model improvement on software development tasks.
Finally, all of these things fit together. As part of our Kubernetes orchestrator, we build each individual piece of the Model Factory as a Docker container, which we then deploy on various node pools. The exact details of the deployment depend entirely on the cluster's current workload and the workflow itself, but our orchestrator allows us to preempt low-priority jobs in favor of more pressing jobs. Moreover, the orchestrator itself also supports backfill, enabling quick jobs to be finished quickly.
Thank you
We hope you enjoyed this tour of our Model Factory. Check out our next installment for a deep dive into our data pipelines, our workflows, and a discussion of how we process and refine massive datasets for use in LLM training.